Challenge
Improve usability of the calculator to increase the number of developers who complete the process and sign up to learn more.
The LTV Calculator is way of helping educate developers around the concepts of LTV, and give them a valuable tool to establish if paid user acquisition makes sense. If developers can invest ROI in a positive way, then Pollen can help them grow by helping them reinvest quicker.


PREVIOUS CALCULATOR DESIGN
Process
As a UX Designer, it’s part of my job to articulate my design decisions in order to receive buy-in from stakeholders.
I first began with research to learn about existing customers’ experience using the calculator. I immediately received pushback about why this was necessary and was told to focus on speaking with potential customers as the goal is to gain new customers. I explained that current users would provide valuable insight, in addition to potential customers, because they are already familiar with the tool.

USABILITY TEST GUIDE
Research
I interviewed 2 current customers and 3 stakeholders. I also conducted usability testing with 6 potential customers on the existing calculator. My goal was to identify any usability problems, collect qualitative and quantitative data and determine the user’s satisfaction with the calculator.
My first step was to define research goals so I knew what I was trying to find out. I came up with the following user and interview goals to help guide my research.
User Goals:
- Understand what Pollen.vc offers and how the business works
- Eliminate possible skepticism or concerns with the calculator and results
- Make it easier to fill out the calculator in order to achieve impactful results
Interview Goals:
- Gather user experiences about using the site and LTV calculator
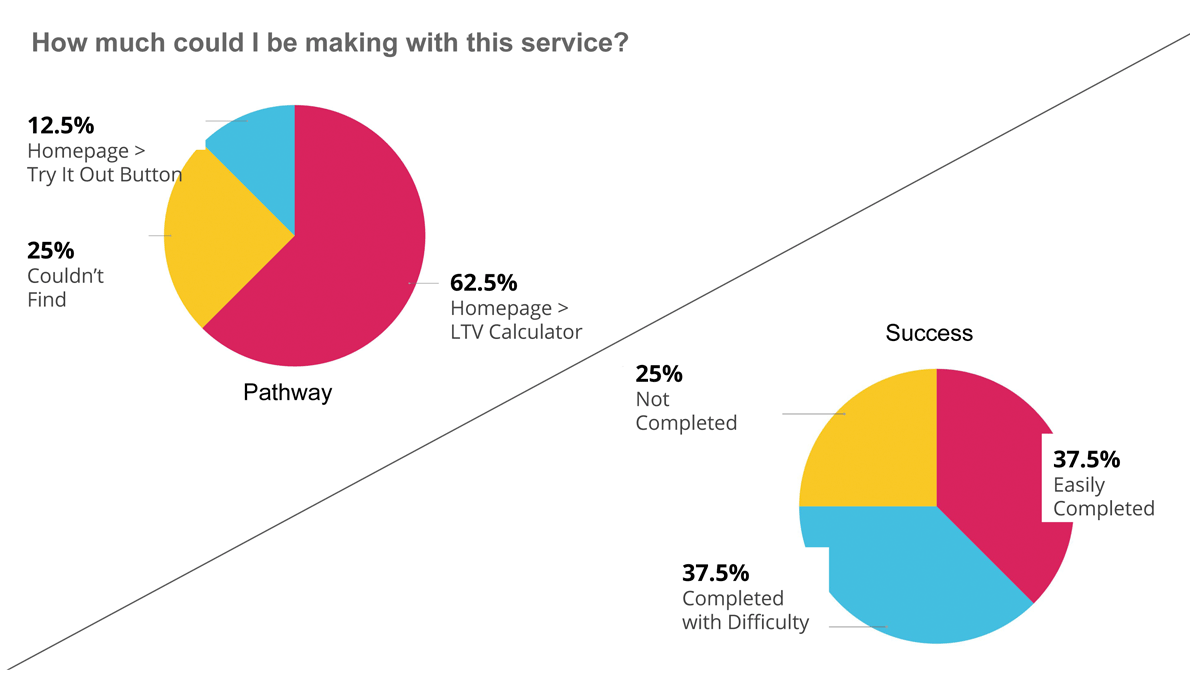
- Learn how users complete specific tasks and how successful they are
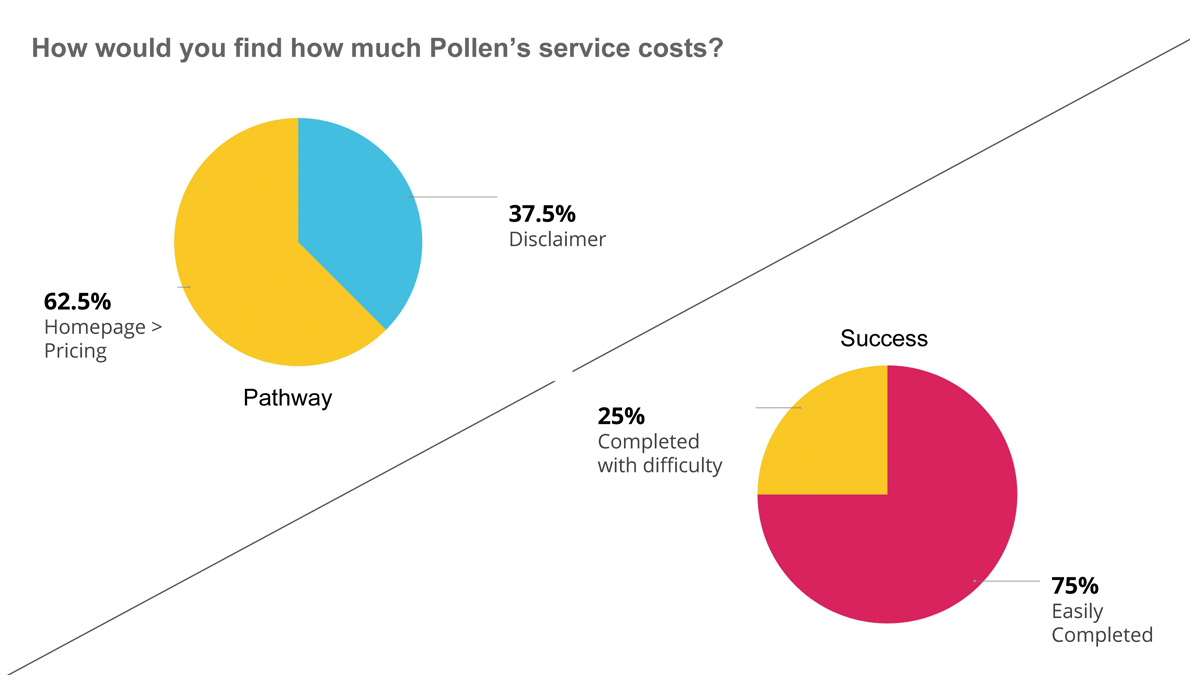
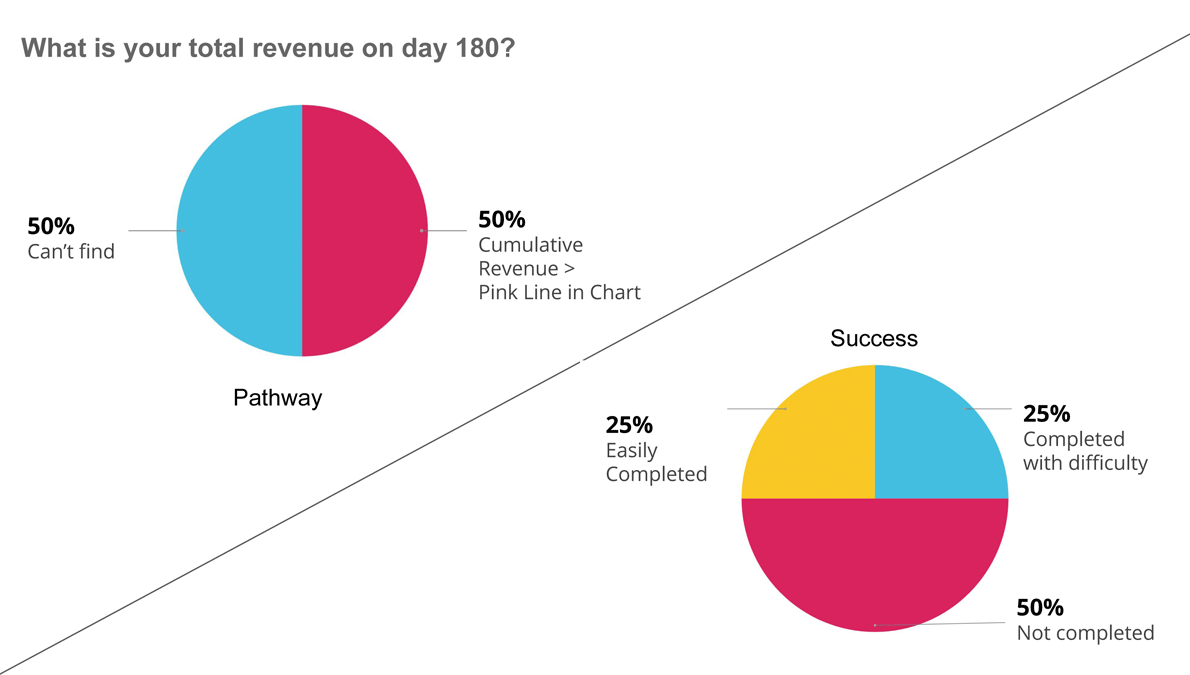
USABILITY TEST RESULTS
Research Findings
- Customers need to learn how Pollen works before they understand how Pollen can help them.
- Before seeking assistance, self sufficient customers like to answer their questions on their own.
- Customers seek pricing information to gain transparency of business model
- The amount of data shown at once overwhelms users and makes it difficult to digest
- Lack of visual differentiation between data points resulted in confusion
User Quotes
“It seems like it’s a bit marketing heavy. I feel like for me to think this is believable I would actually have to know what the methodology is.``
“I can’t tell the difference between the two colors in the chart. I have no idea actually.”
“I need to analyze them to see if what they say is true.”
Quantitative Insights
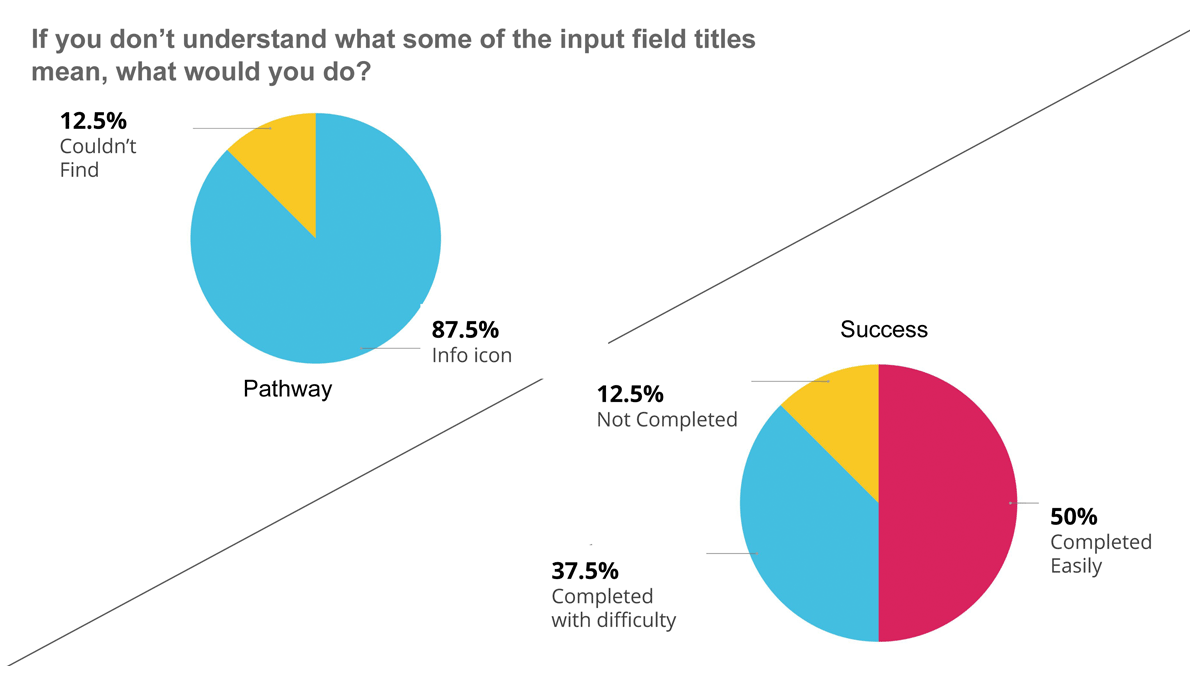
Analyzing a heatmap of the existing calculator page helped me understand how users interacted with the page. I was able to see some behavior patterns and how users interacted with specific features. We can see the most clicked areas are the “info” icons next to the abbreviated titles. This indicates that users do not know what the abbreviations mean, so they are seeking explanation.
In addition, users are clicking on the fields that have default values and skipping the rest before clicking the calculate results button. This indicates that users either do not know what to input, or they simply want to see a what an example of the final result.
My interviews validated this behavior as multiple users said they immediately calculated results without inputting information. Users wanted to see what the results looked like before spending time entering in data.

HEAT MAP TRACKING CLICKS via HOTJAR.COM
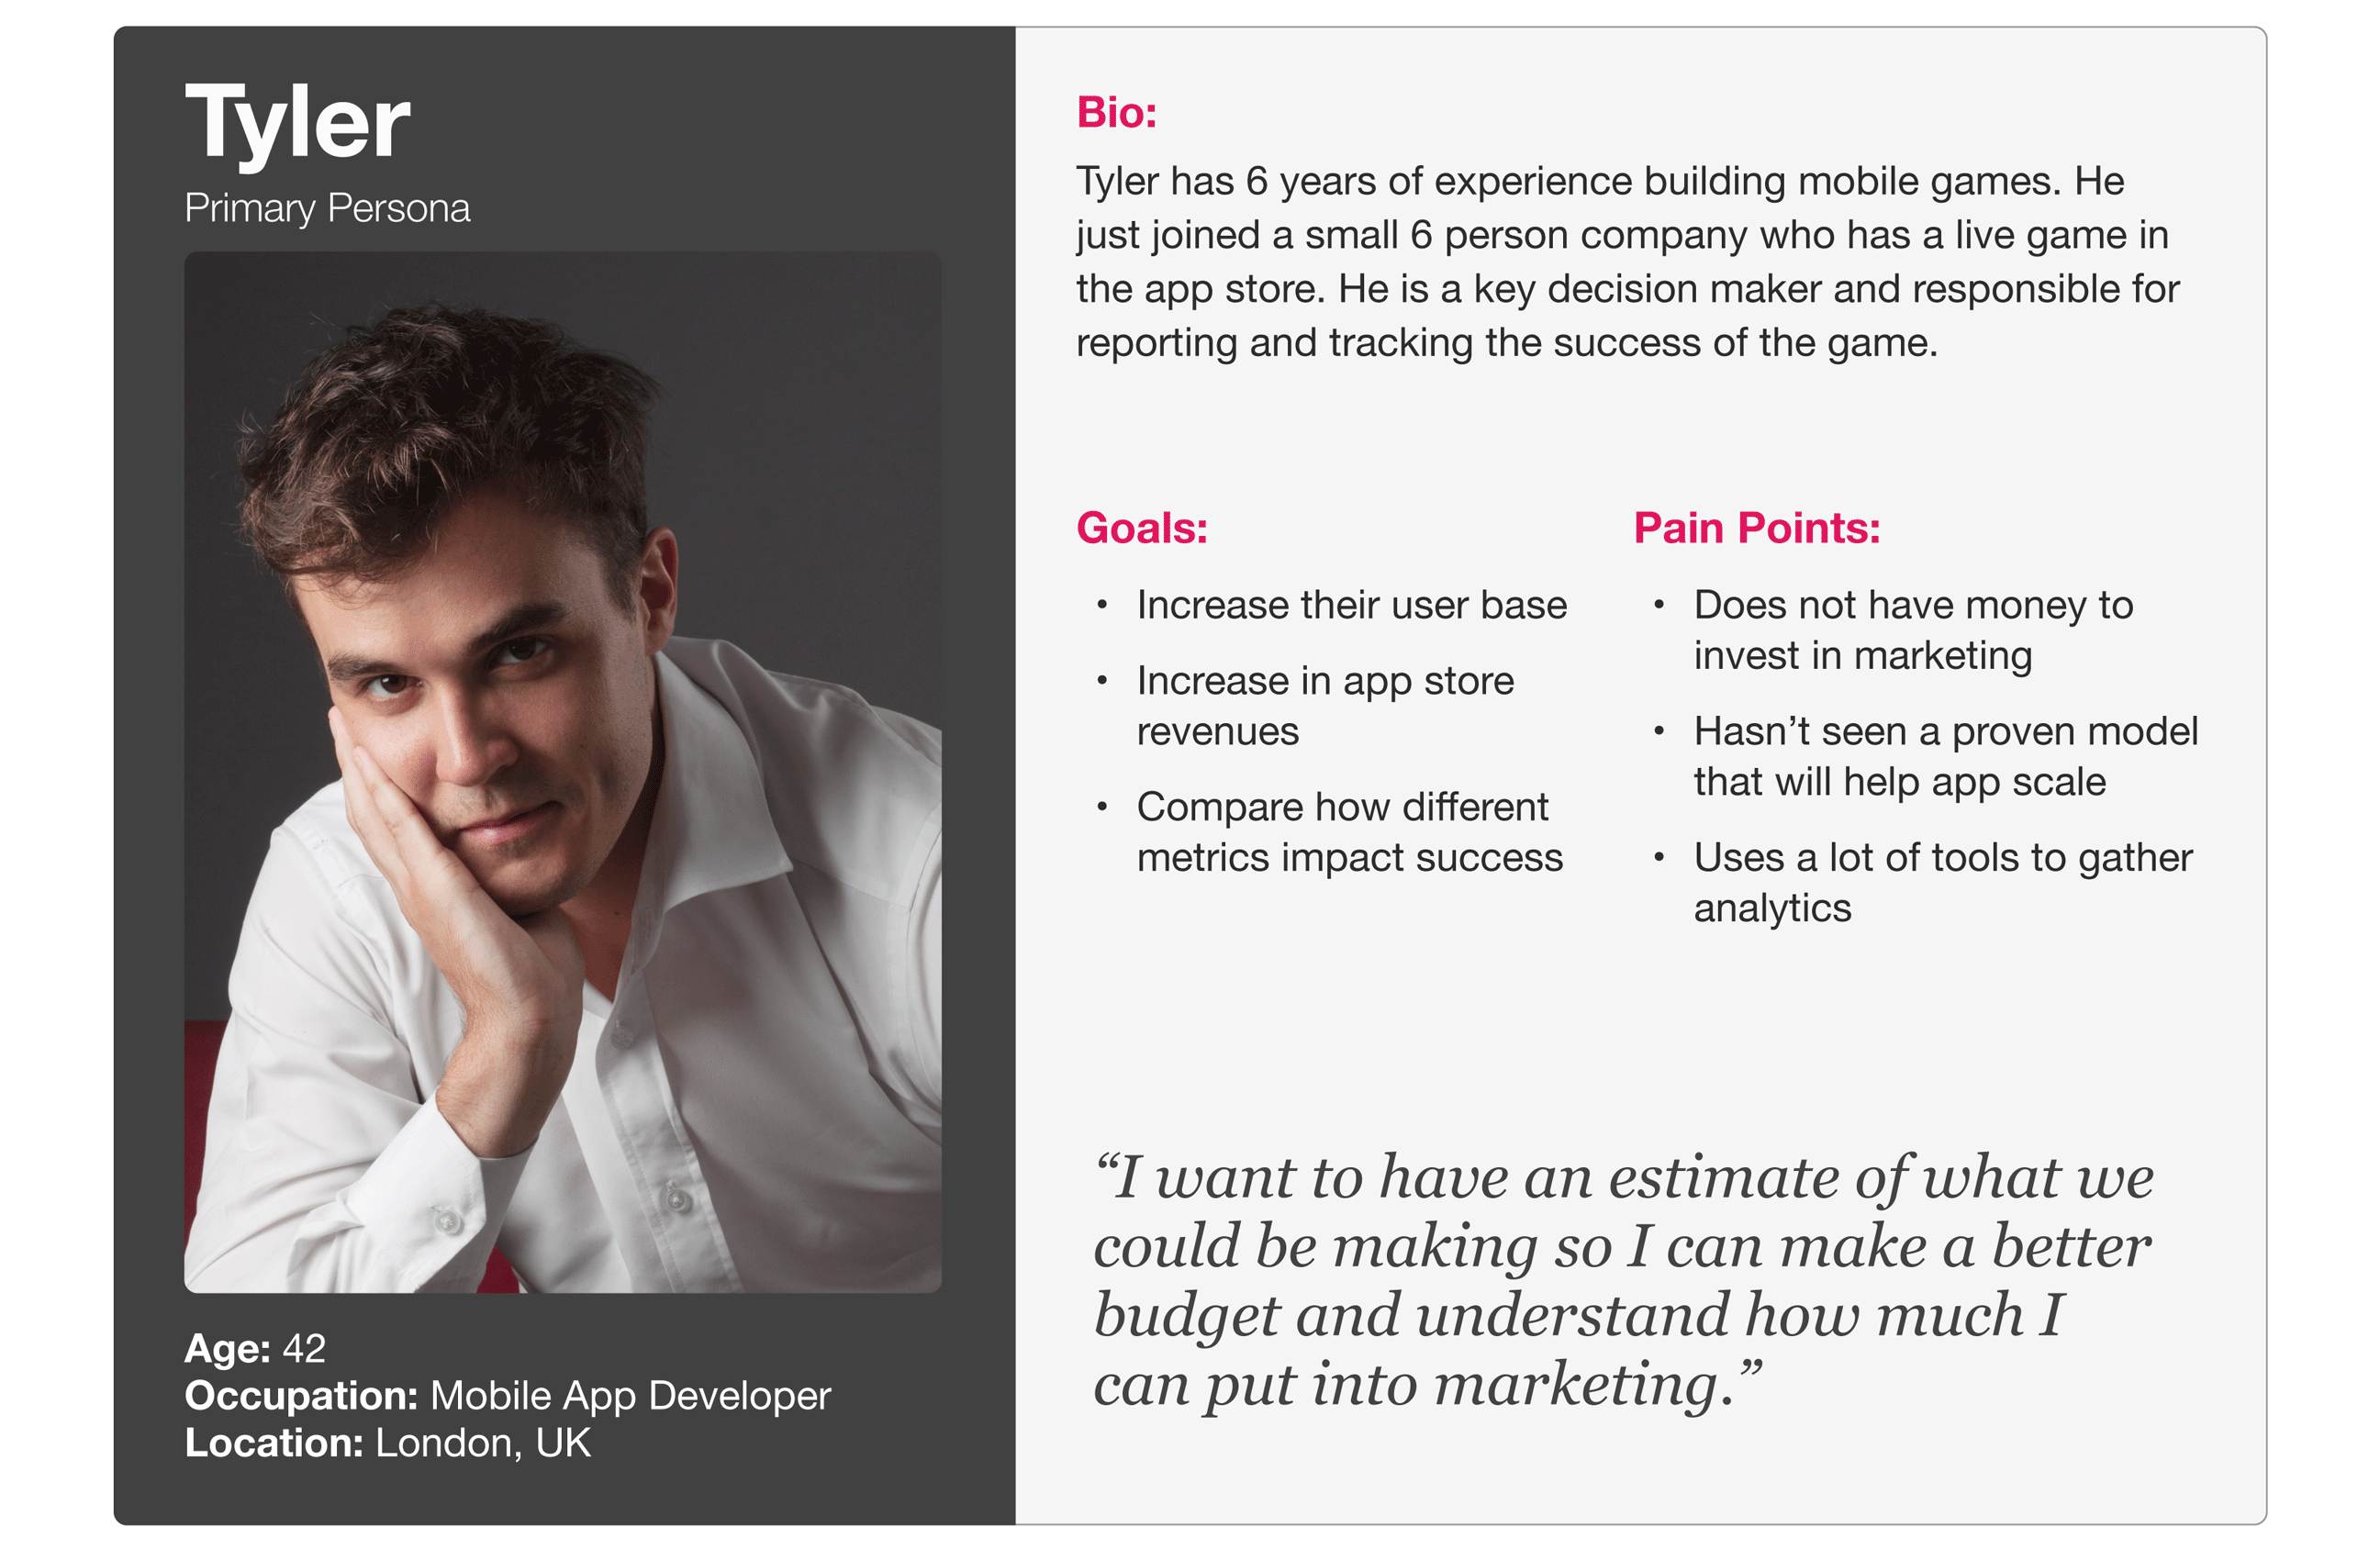
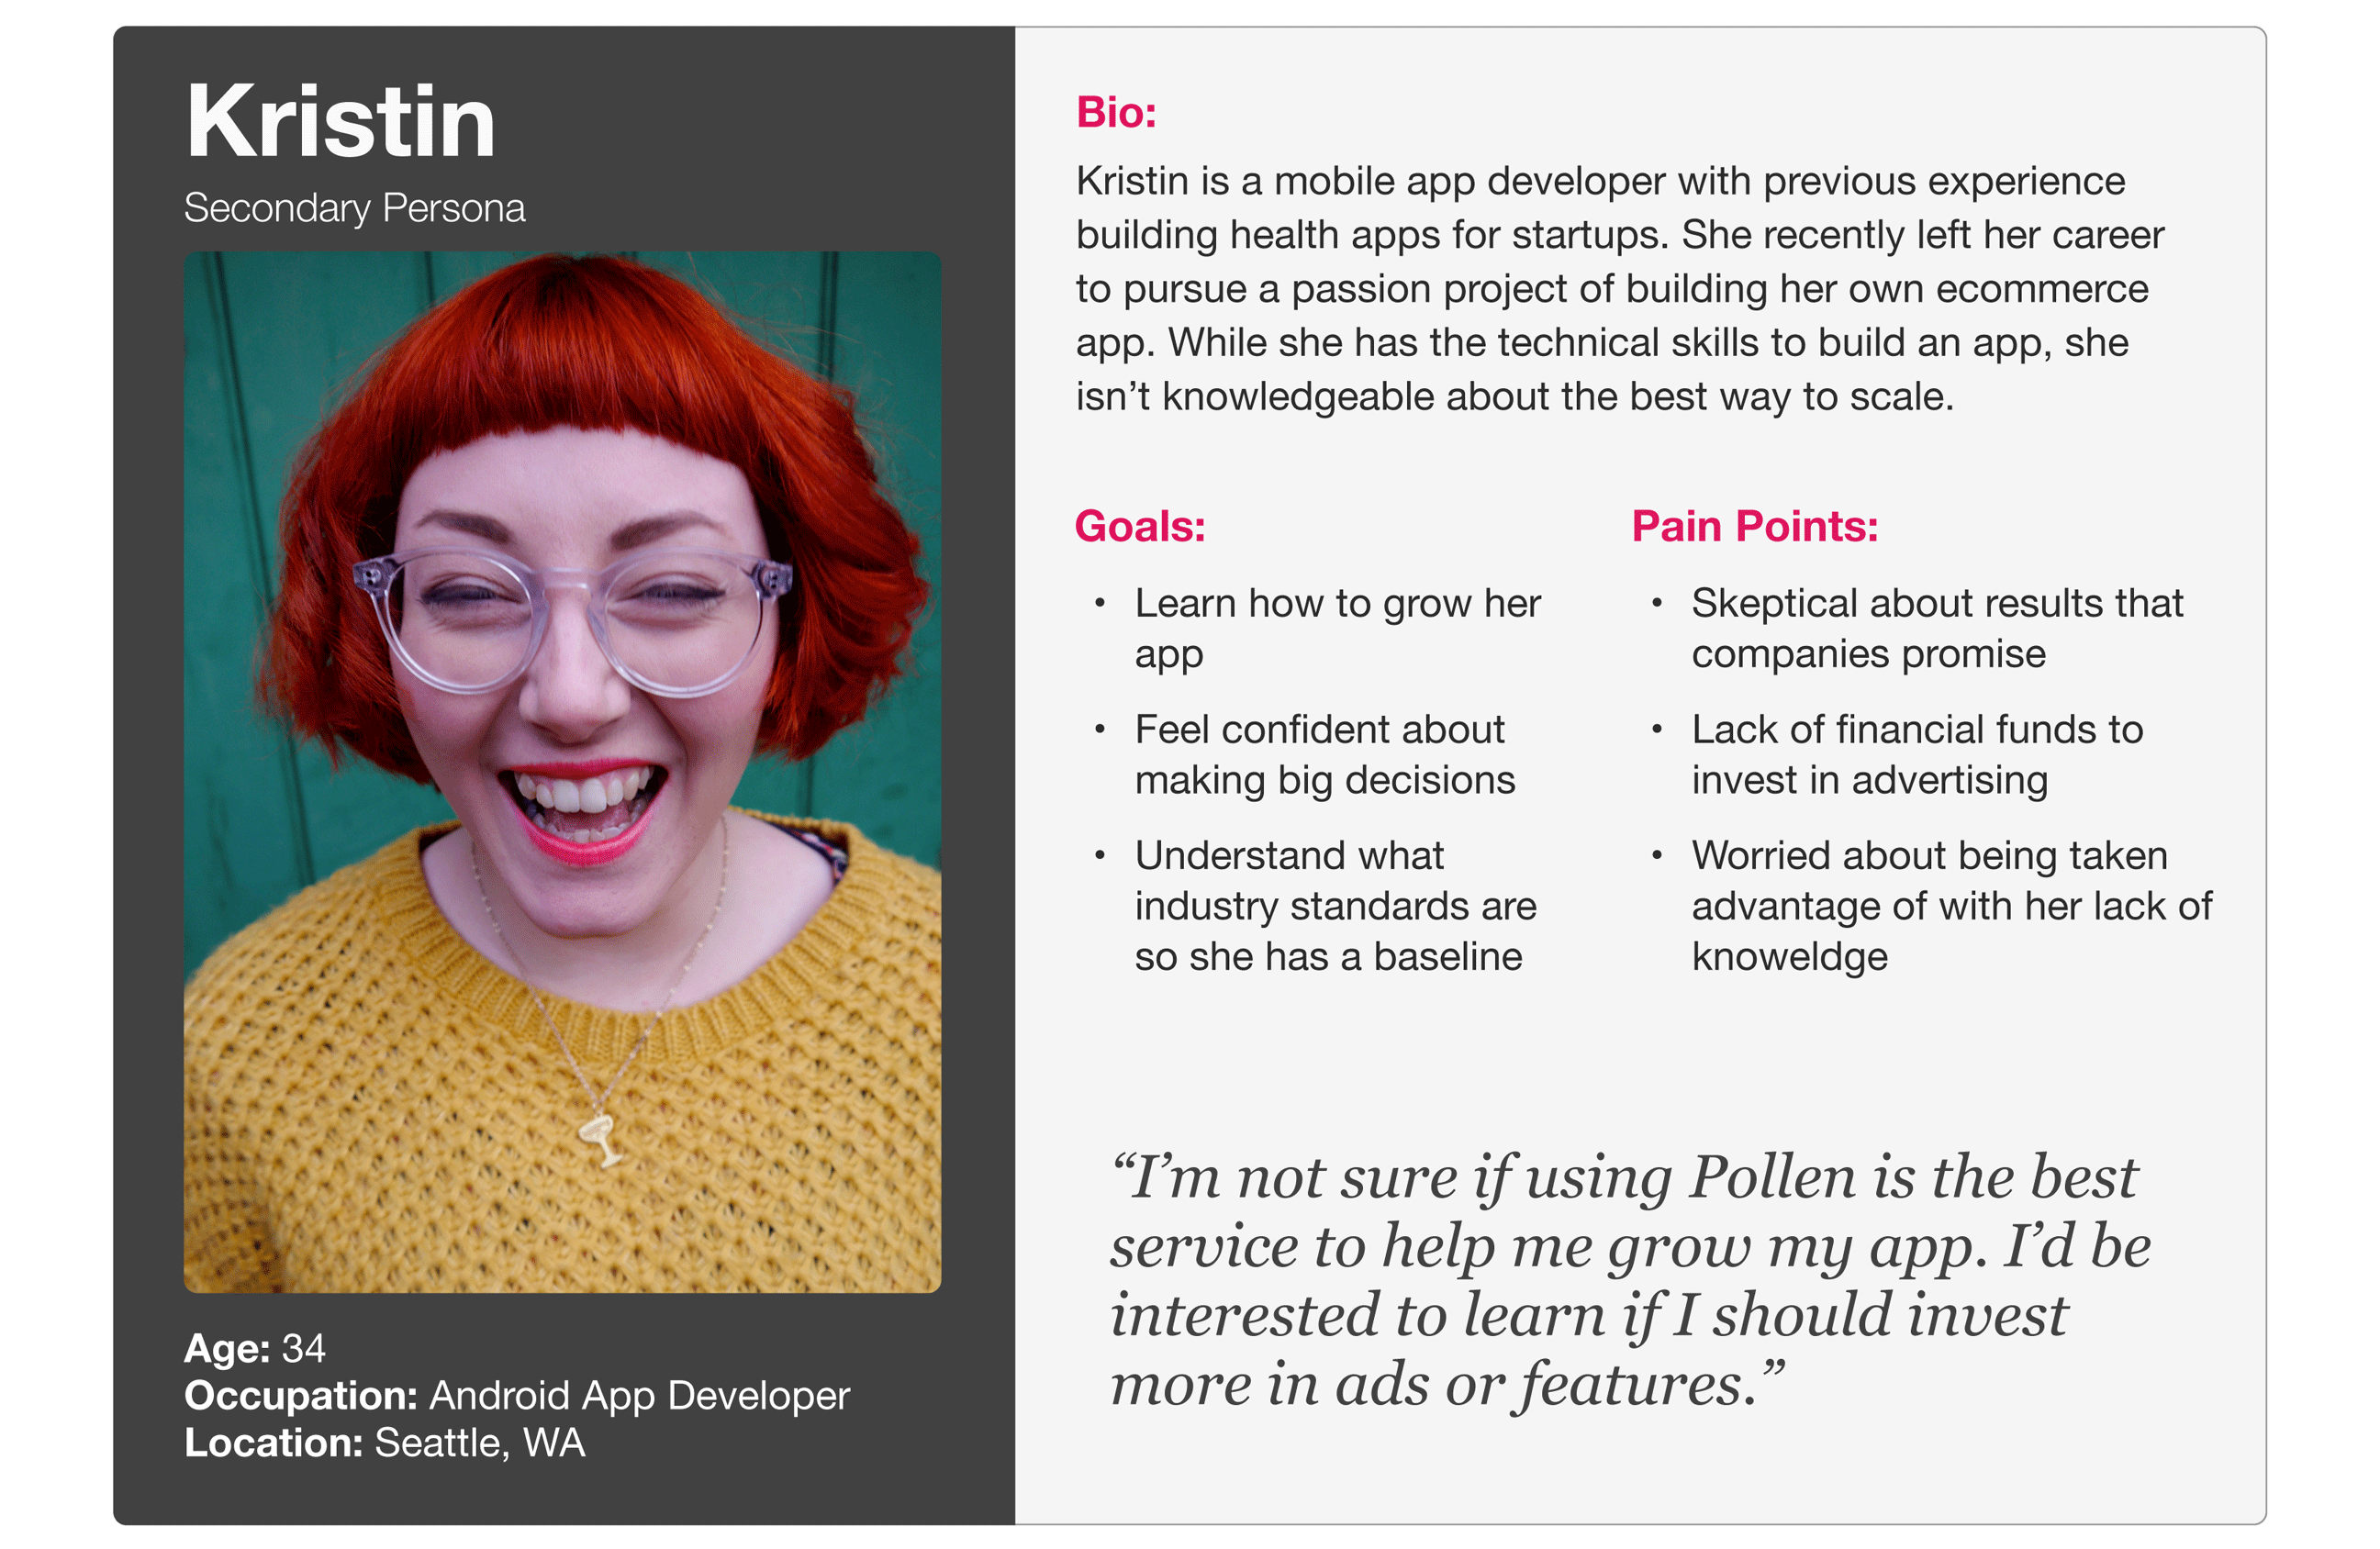
Personas
Based on my research findings, I created a primary and secondary persona to help guide my design decisions. The primary persona is the more experienced user who is familiar with apps and monetization. The secondary persona is inexperienced with app monetization but wants to learn more.
User Flows
Before sketching any ideas, I created user flows to help me understand how the user moves through the calculator. This helped me analyze every step of the task so I could improve it and make it easier for users.

Design Exploration
I used pen and paper to quickly sketch my initial ideas. Based on my user interviews and usability tests, the existing calculator page was a lot to take in. I chose to turn this process into a wizard format in order to guide users through each step. The results were also difficult to understand because of the amount of data that was presented and the positioning of elements hid information.

IDEATION SKETCHES
Wireframes
I moved my best ideas into Sketch to create low fidelity wireframes. I focused on creating a less overwhelming experience by guiding users through the calculator. Because users did not trust Pollen, I simplified the messaging and aimed to be completely transparent by providing key explanations about how information was being used. To accommodate the advanced user, it was important to give them an option to skip the wizard flow completely.
On the results page, I wanted to provide a quick way for people to interpret the information without needing to look at data in the charts. Providing an overview with a breakdown helps build trust by being transparent with what fees are Pollen takes from the total revenue earned.


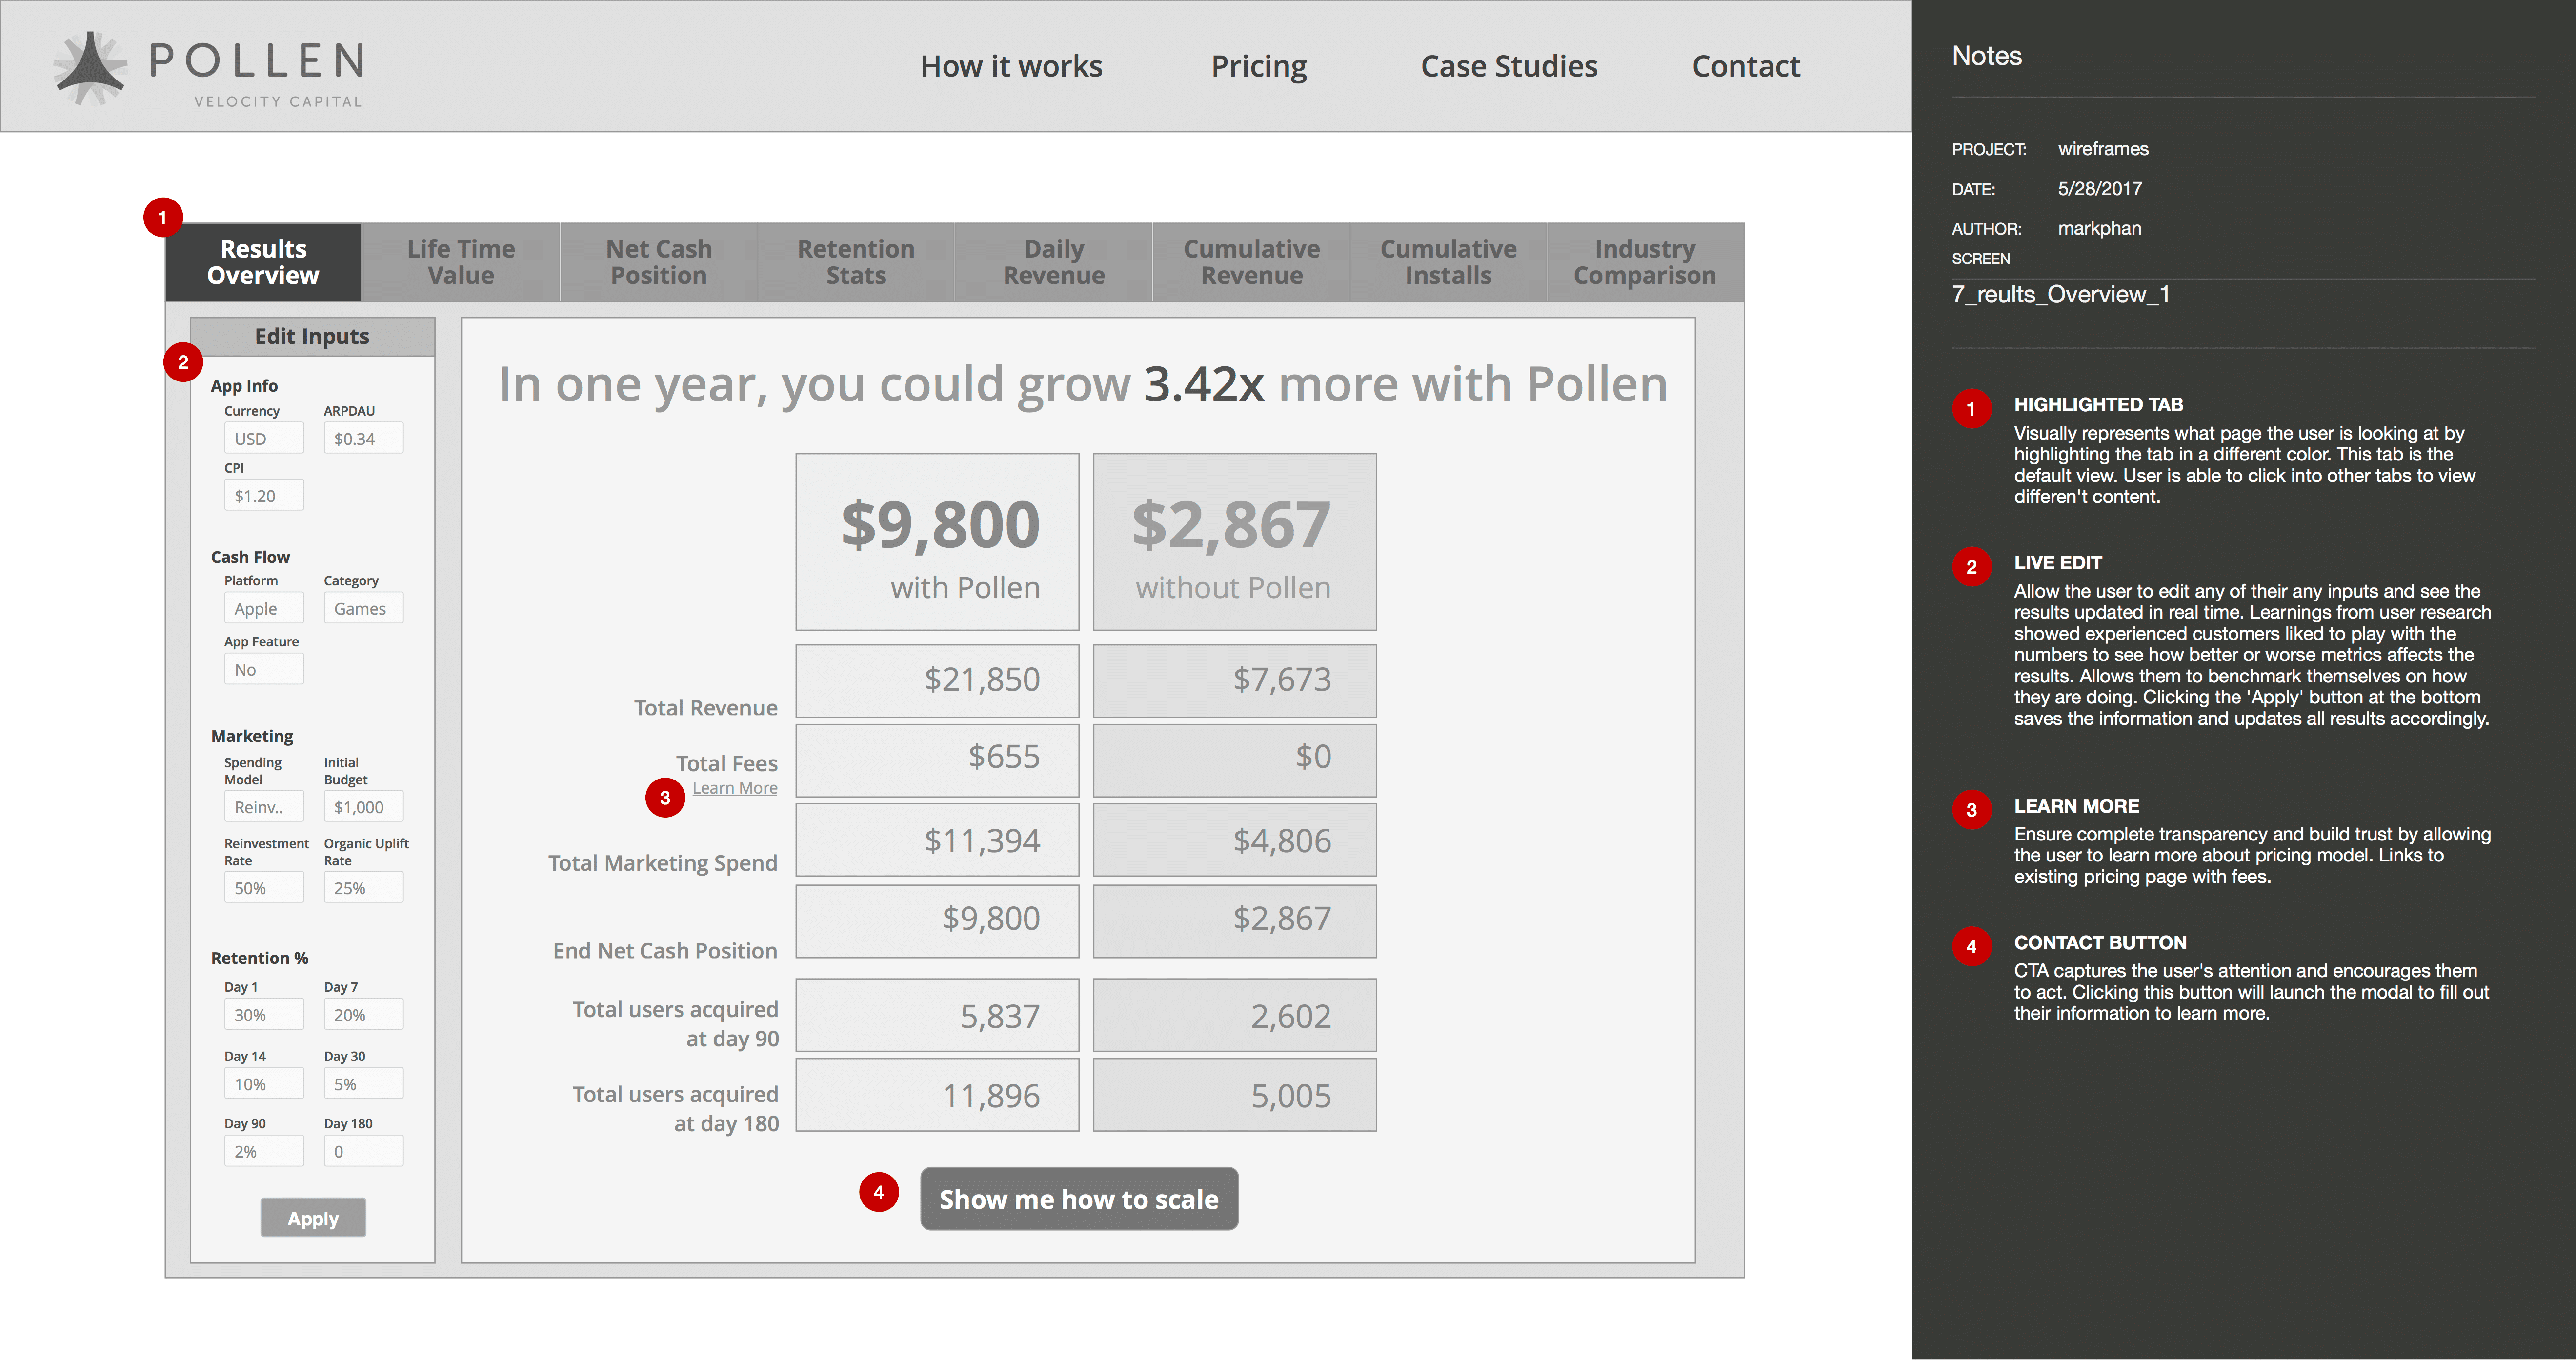
ANNOTATED WIREFRAMES FOR DEVELOPERS
Prototype
I created a prototype using Invision which you can see the final product below.
Final Demo
Result
Presenting research videos was impactful and helped stakeholders develop empathy for their users.
They were quite shocked when I presented the research, specifically when sharing videos of user’s frustrations trying to use the calculator. They acknowledged they’ve neglected the user experience because they’ve been so focused on building new features. The developer is currently in the process of redeveloping the calculator based on my findings.
Working with Mark on revamping the UX of our online LTV modeling tool was a great experience. He took the time to understand our business goals and then set out to improve the flow from end to end. Using a combination of customer interviews and data driven analysis together with a creative design approach, he was able to create a more robust and intuitive user journey in just two weeks. His deliverables were clear and well thought-out. A great resource for our developers. I would have no hesitation in recommending Mark, and hope to work with him again in the future.

Mark worked for us at Pollen with the aim of improving the UX and design of our online LTV tool. Despite being a short term project, Mark achieved a lot in a short space of time - conducting interviews and usability testing with customers to gain insightful feedback and understanding what the pain points were in the current design of our tool. From this, Mark prototyped, designed and wireframed a complete redesign of the our online tool with the aim of improving the UX and ultimately helping increase our lead gen . Mark was very methodical in his approach and ultimately delivered his findings and suggestions in great depth and to a exceptional standard. We are currently in the process of redeveloping the site based on his findings and his great work.

Next step: Usability testing with the prototype to uncover usability issues, discover areas of improvement, and refine.
Key Learnings
Conveying user research findings so stakeholders can understand them and believe them was something I struggled with initially. I developed a lot of empathy for the users after conducting the usability tests and interviews, but I needed a powerful way to present my findings to the client. I recorded the usability tests and shared video clips with the client so they could see and hear exactly what users were doing. This was extremely valuable to help stakeholders develop empathy and validated my design decisions.